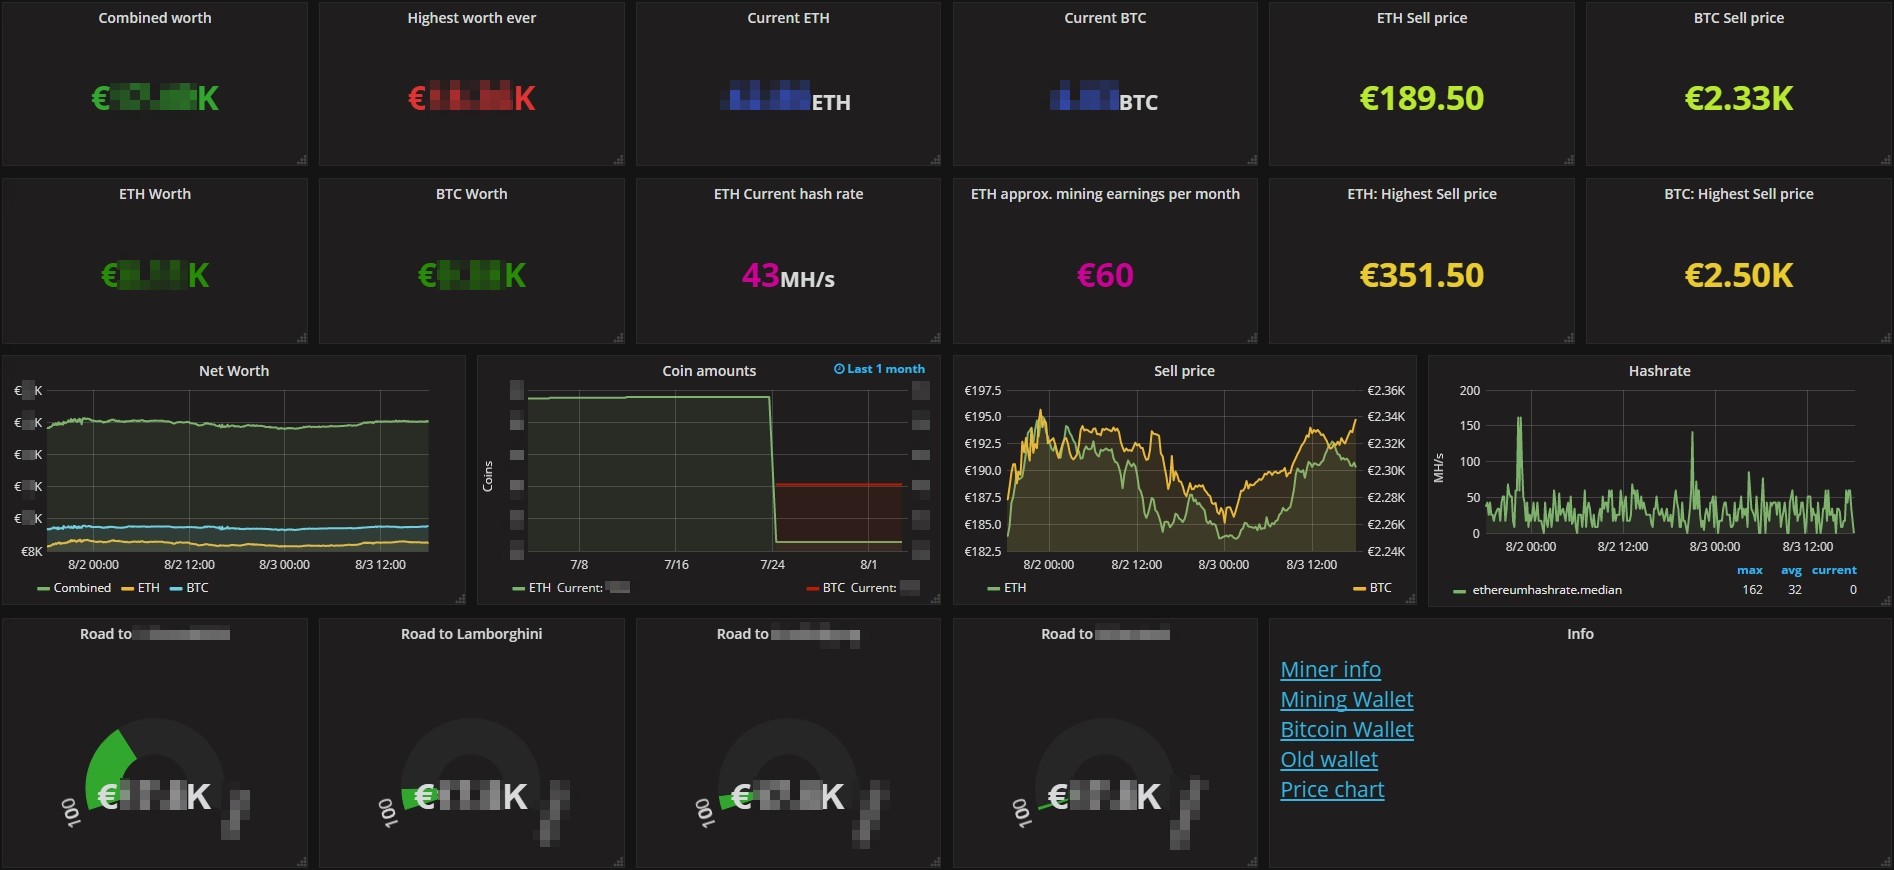
If you have invested in crypto currencies in order to hodl them you might find yourself checking the prices every couple days hours minutes. I've been there and I wanted a way to have everything I care about on one page. So I implemented this simple Grafana dashboard on top of InfluxDB and polling the data via PHP.
Step 1: Get the database
My db of choice for time based data is InfluxDB because it's blazing fast, can devour everything you throw at it even if its a million datapoints per second and it can receive data via UDP and a simple protocol they call "line protocol" (which is actually just a set of comma separated values).
First install InfluxDB and just add the following lines to your /etc/influxdb/influxdb.conf file:
[[udp]]
  enabled = true
  bind-address = ":8072"
  database = "coinsworth"
  retention-policy = ""
  batch-size = 10
  batch-pending = 5
  read-buffer = 0
  batch-timeout = "10s"
  precision = ""
This opens up UDP port 8072 and binds it to (and automatically creates) the db called "coinsworth" which will hold all data for your dashboard. Batch timeout 10s means that the values you send to InfluxDB will be held in RAM for 10 seconds or until 10 data values are submitted before writing it to the disk.
Why UDP and not the default HTTP API? Because I like the UDP approach better, it's much easier to implement in various scripts and the HTTP API has changed quite often with newer versions but UDP always directly uses the line protocol which means lower maintanance for the scripts.
Restart The InfluxDB service and the port should be open. But don't expose the UDP port to the web without proper firewall configuration since UDP is unencrypted.
Step 2: Collect the data
I have written this little 160 lines PHP script that collects all data and sends it to InfluxDB via UDP.
What does it do?
- Log your wallets balances
- Log the current price of Bitcoin and Ethereum
- Calculate the worth of your individual wallets and the sum of all wallets (coins times price)
- Check your ETH wallets for Nanopool mining and log the hashrate
- Calculate your monthly earnings on top of the received hashrate and log them too
https://gist.github.com/geek-at/e78e80d3305e989a5a00df3e9beb5923
Just change the currency you want to use to EUR/USD/GBP, add your wallet addresses in the PHP array and set the IP and port to your InfluxDB box.
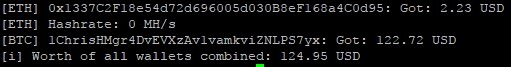
Run it via php coindata.php for this nice output:
Set up a crontab that runs every minute with the command crontab -e
And appending these lines:
#crypto logger for the dashboard
* * * * * php /path/to/your/coindata.php
Be sure to have the bc-math extensions for php installed tho!
Done!
Step 3: Display your data
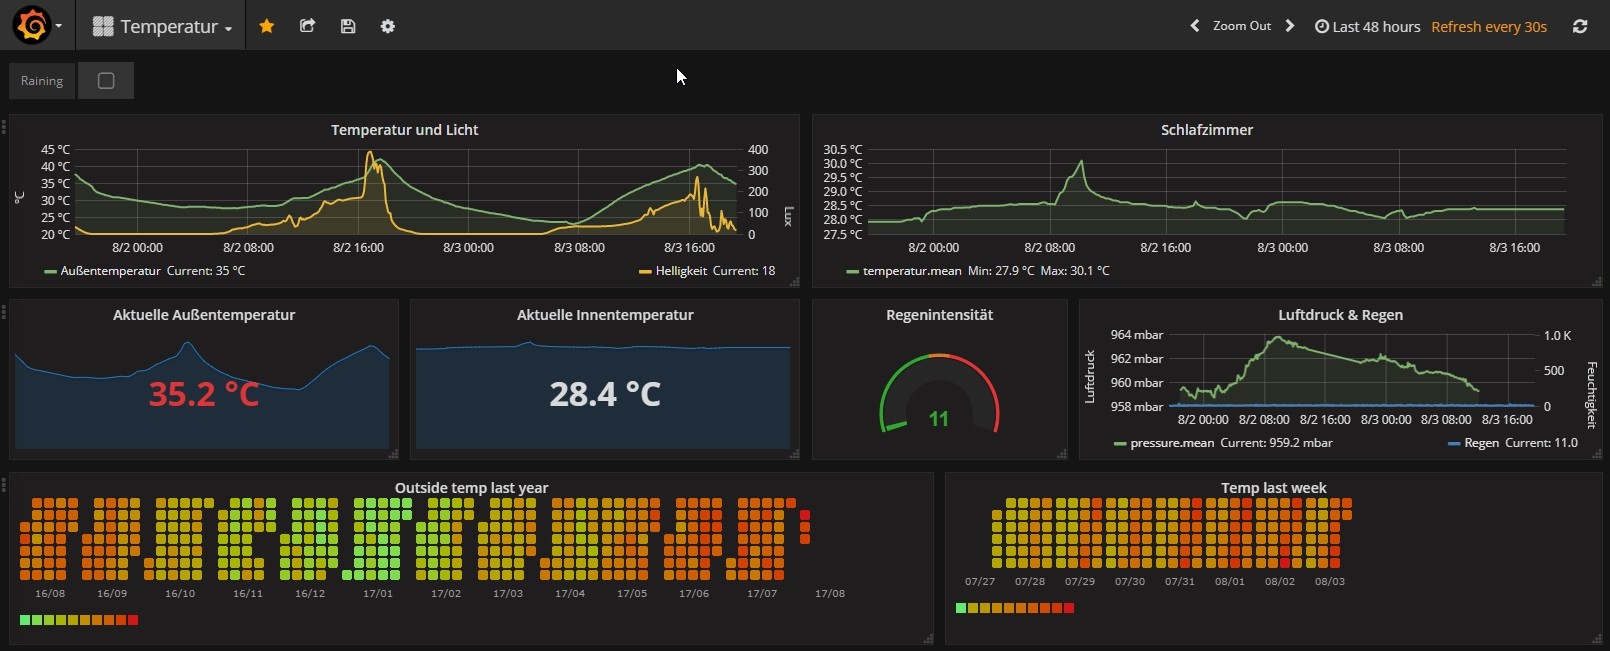
Grafana is my go-to dashboard solution and I use it for many projects. It's simple and connects right to InfluxDB.
First install it in accordance to the projects website (install it on the same machine you installed InfluxDB on, that makes it a lot easier)
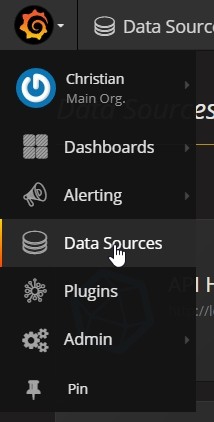
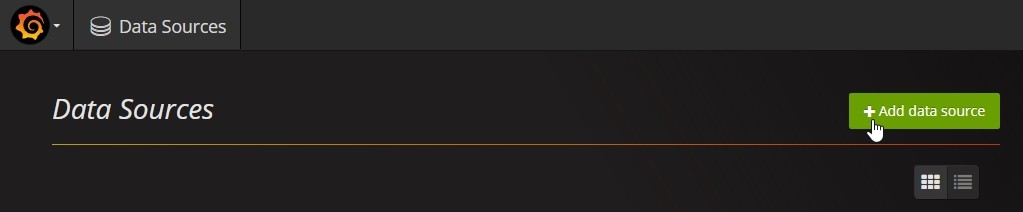
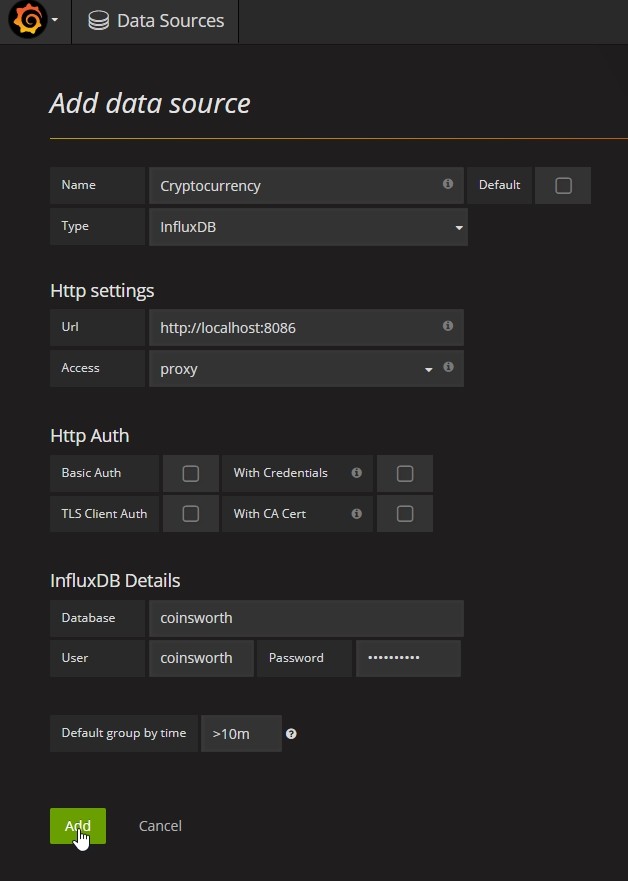
Create a new Data source
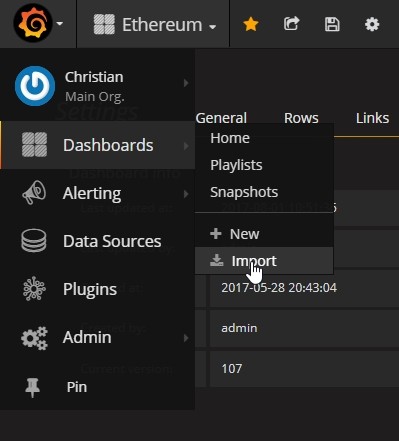
Create the Dashboard
The easiest way is to import a dashboard from my settings and then change it for your needs:
And import the data from this JSON file
Et voilá!

Comment using SSH! Info