As a geek who has a few servers and other devices at home I can't stop thinking about my power output. I always wanted live stats on my power consumption but my power company won't install a smart meter so I had to improvise
Step 1: What do we have and how can we use it?
My power company installed this ISKRA M17 power meter.
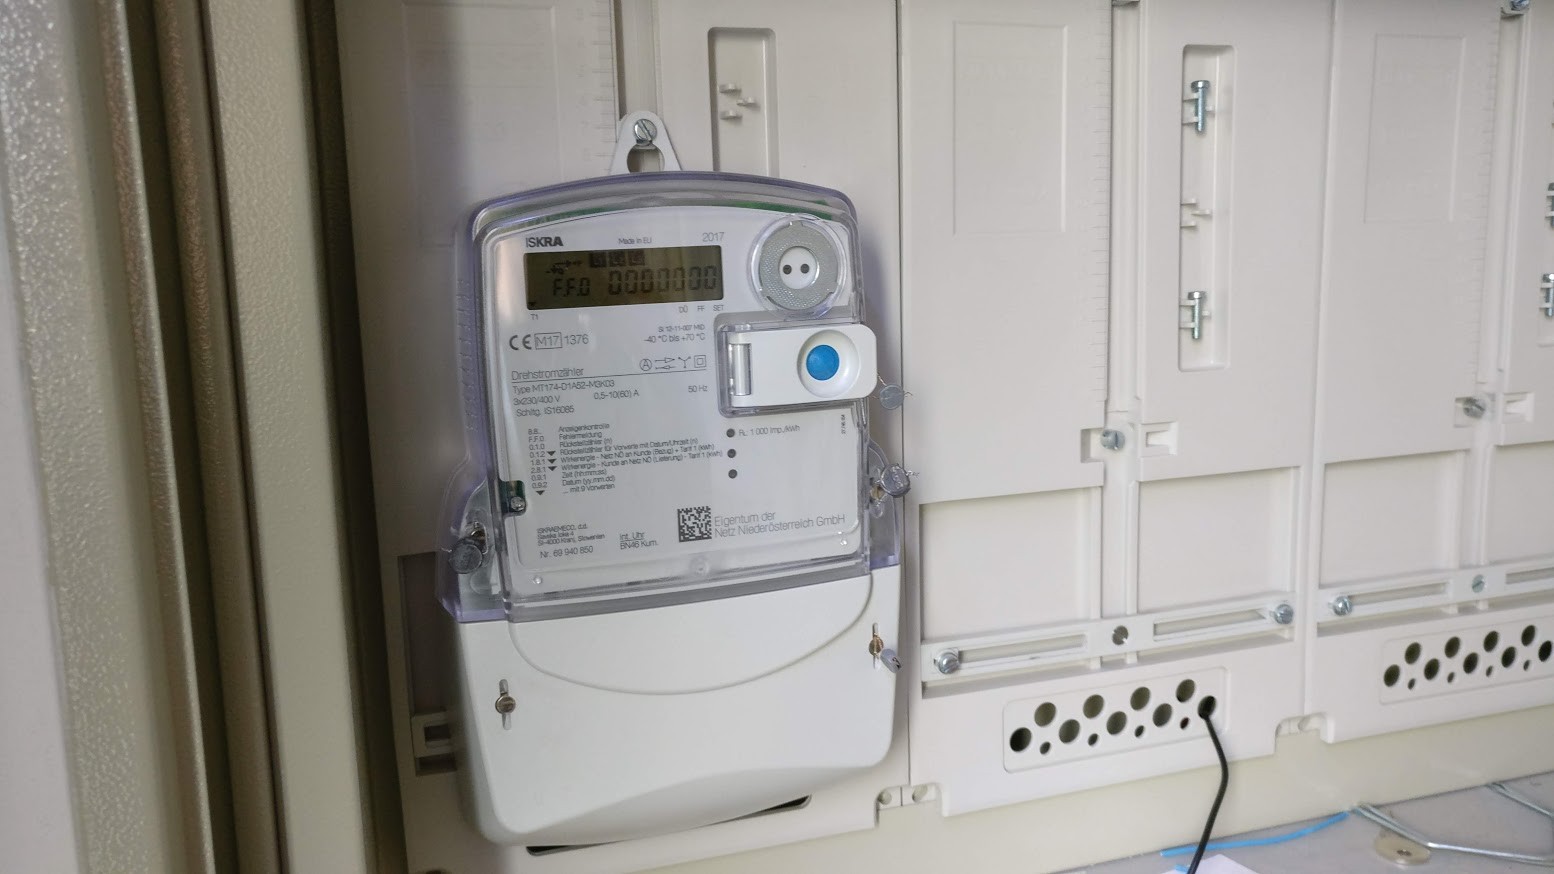
It has no interfacing mechanisms and it was sealed by the power company so I have no chance to attach any probes to the thing and get data directly.
But it has an LED that blinks 1000 times per kWh. So one blink equals 1 watthour of energy usage. Perfect!
Step 2: Building something that can log the blinking
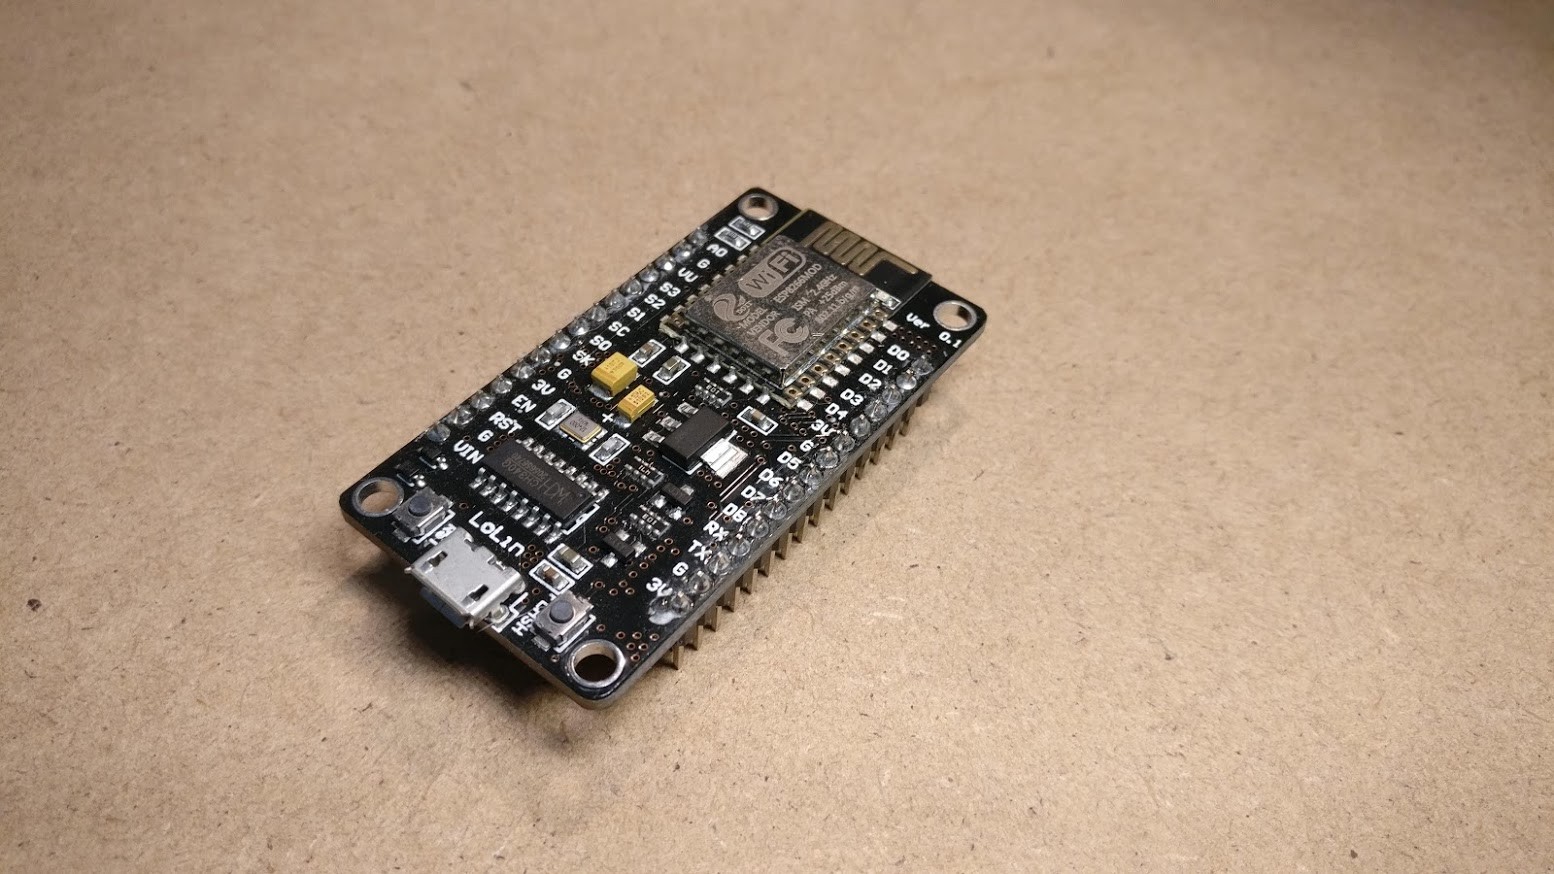
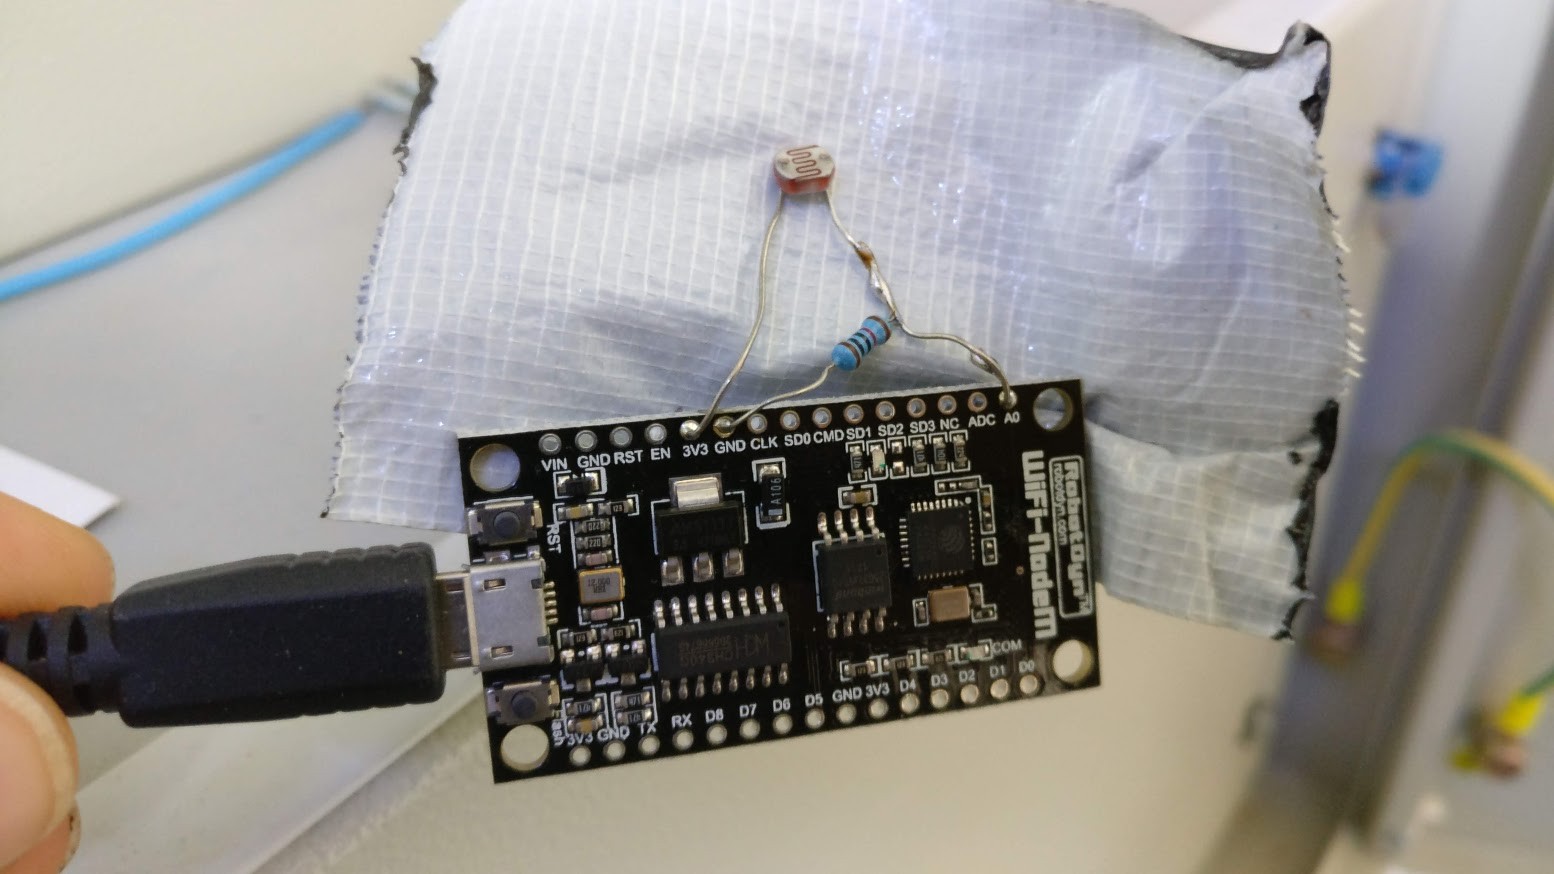
So I need a method to log whenever a light flash occurs. Since I don't have a network cable by the power meter I want to log it via Wifi so a NodeMCU (esp 8266) would be the way to go.
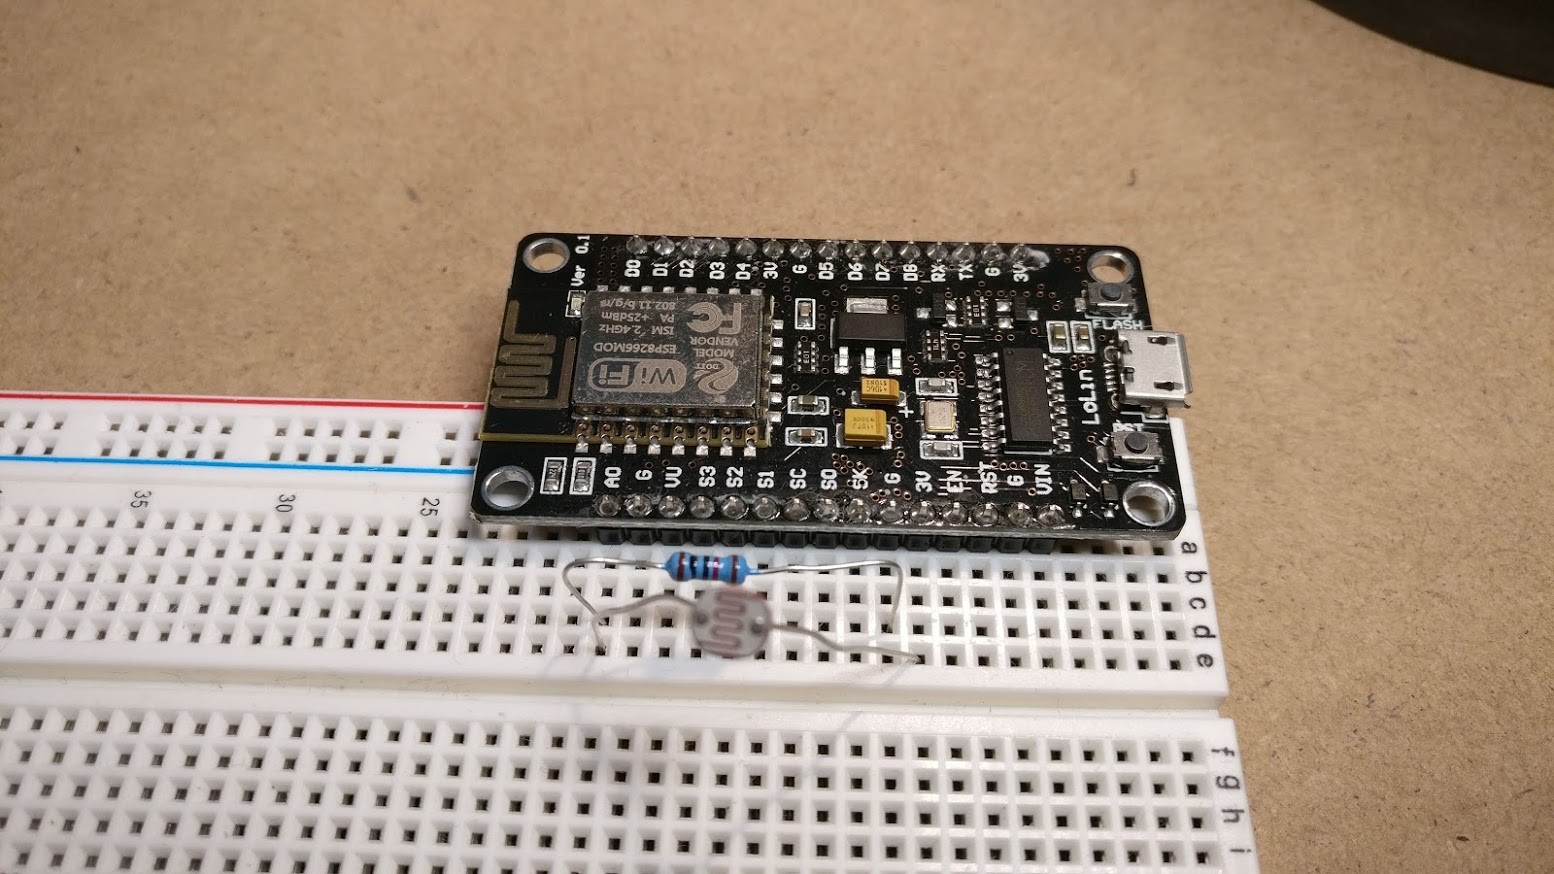
To accomplish this I'm using only three components
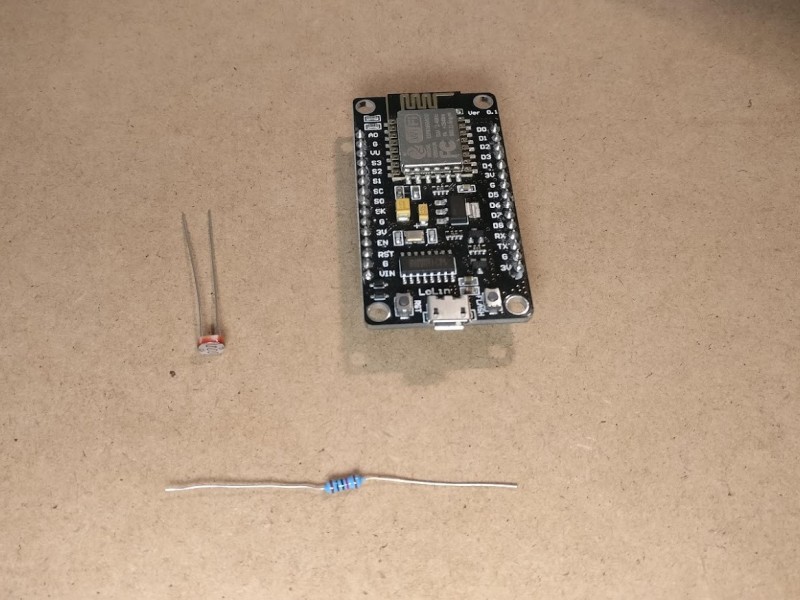
Components in detail

All in all under 4$ including shipping.
Wiring it up for a test
Putting it together and taping it on the power meter
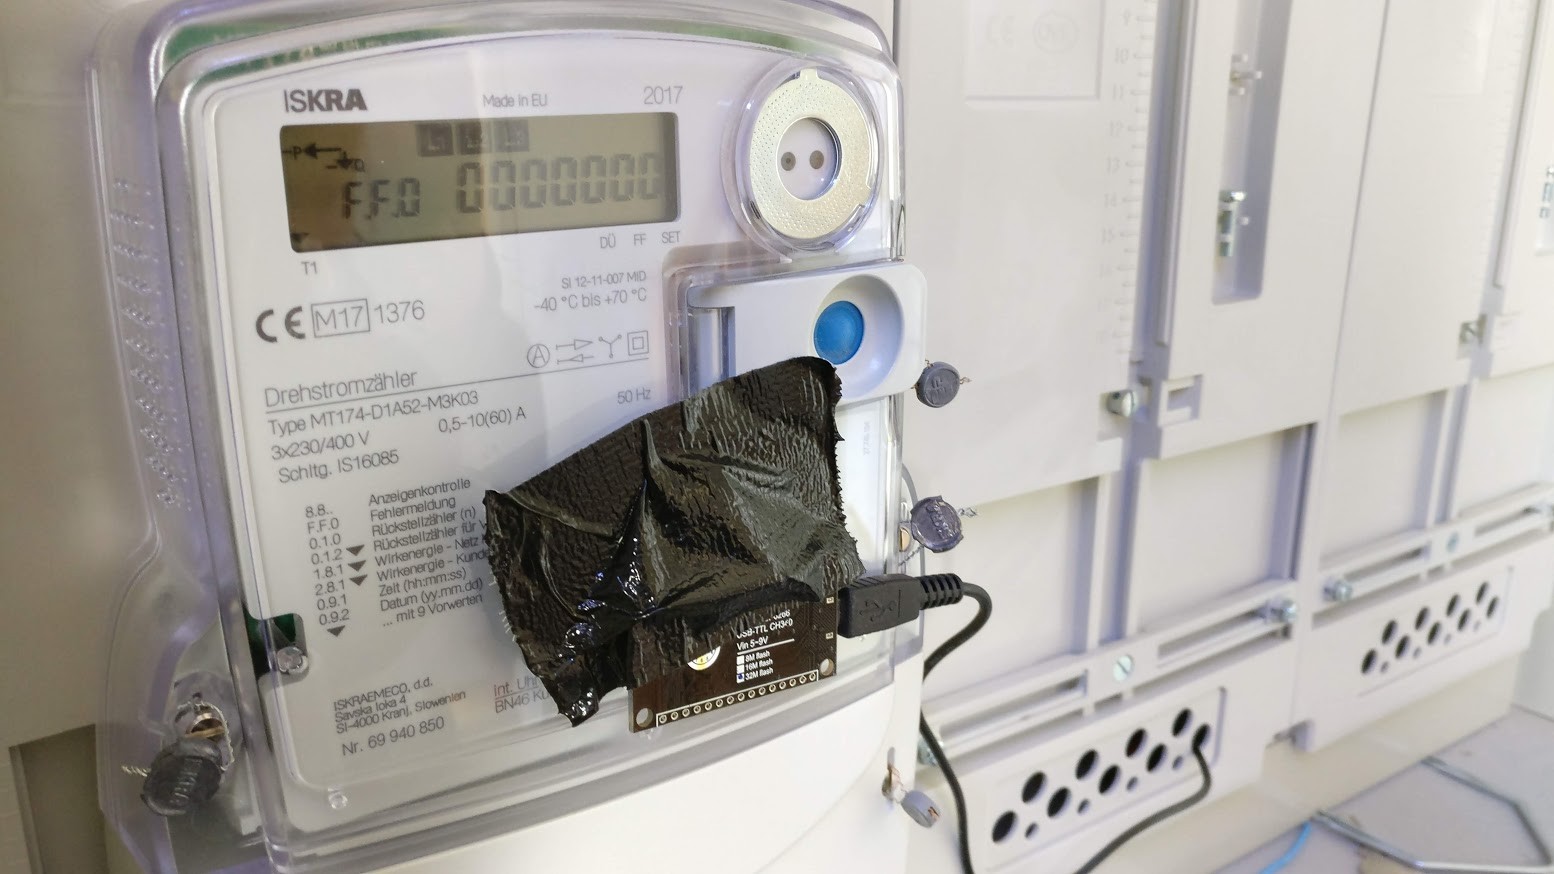
I ended up powering the thing from a 5v rail but if your meter has no power outlet near it you can also use a power bank. I calculated that with a 20100mAh power bank you can power the device for 10 days.
Step 3: Log each blink
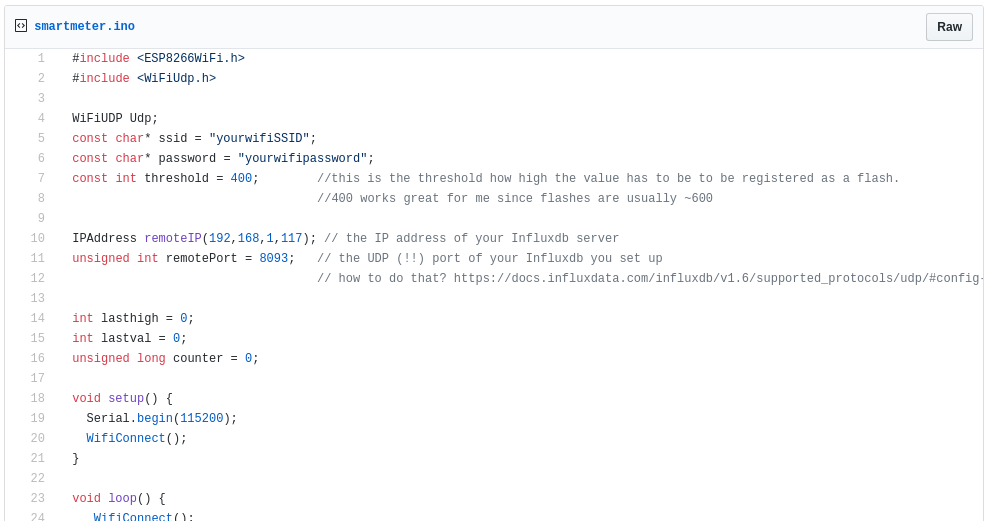
I'm using a simple - just print whatever the analog value is - script. I moved my flashlight over it and we can clearly see each spike.
void setup() {
  Serial.begin(115200);
}

void loop() {
  Serial.println(analogRead(A0));
  delay(10);
}
Now log it to InfluxDB
I chose InfluxDB because it's a timeseries database which means all values you are logging have always the time as primary key and are therefore incredibly fast.
To avoid deadlock situations we're just going to use UDP with InfluxDB. The idea is that each time the NodeMCU sees a spike, we just push a value of "1" to the database. So every time 1 Wh of energy has been used by your house, a "1" will be added to the database.
Why "1"? Because then we can use the "count" or "sum" function of Grafana and we can calculate power usage for any given point in time and range of time. You'll see later what I mean.
I have created a script that not only logs each blink, but also handles wifi disconnects and reboots itelsef if necessary.
Step 4: Make a nice dashboard for it
I'll be using Grafana as a dashboard because it's so beautiful and I love a good looking graph :D
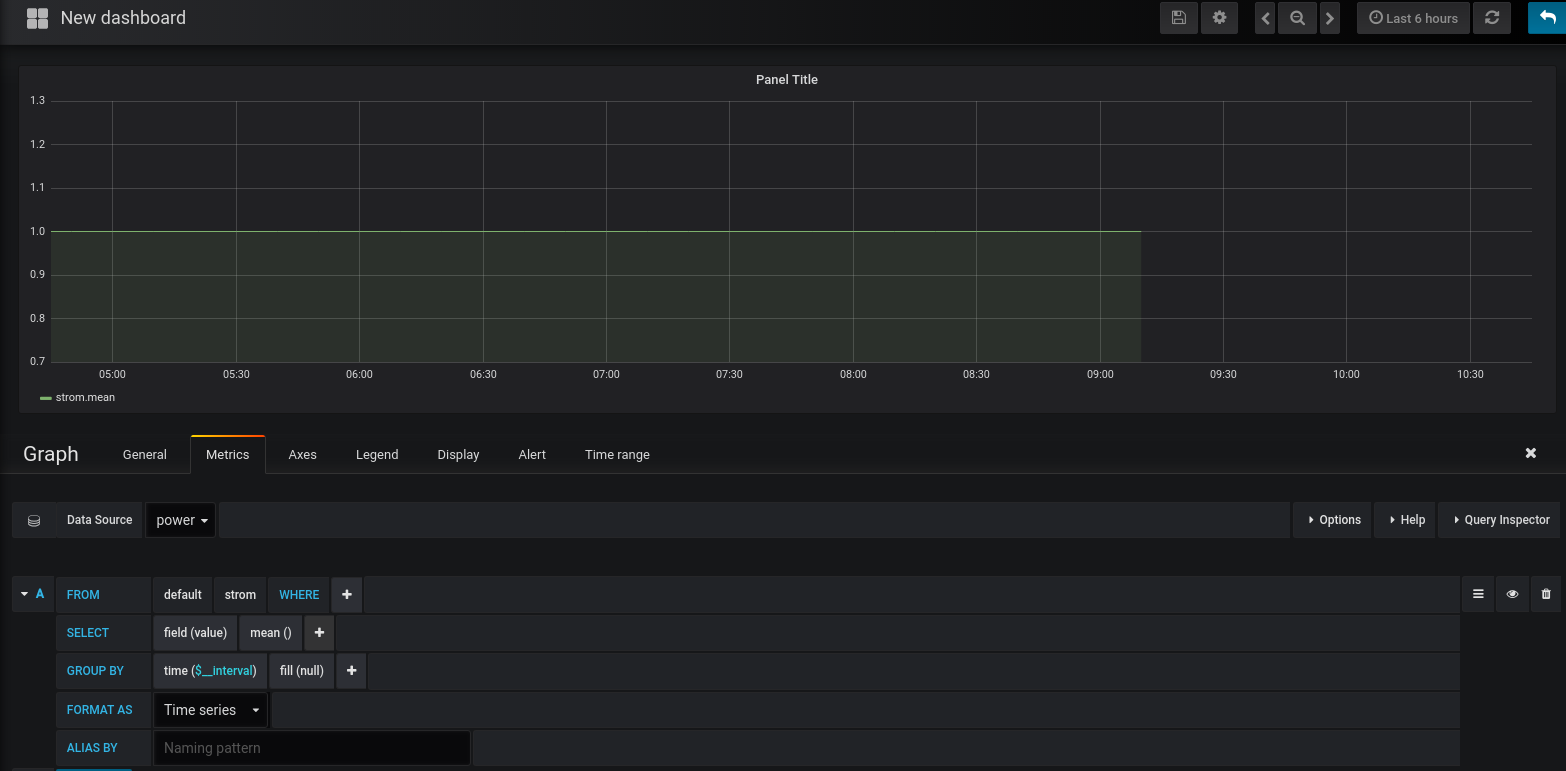
After adding your database as a data source in Grafana, create a new dashboard and select your data source and measurement
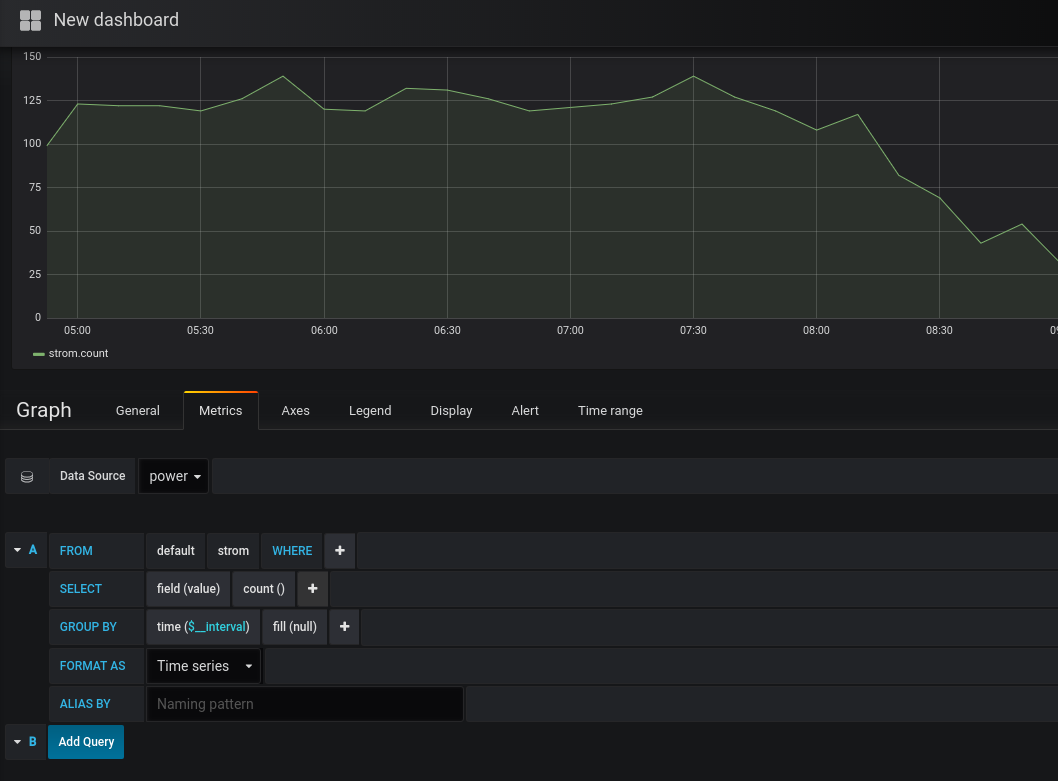
Okay let's make it useful. Click that little "+" icon in the "select" row and select Aggregations -> count
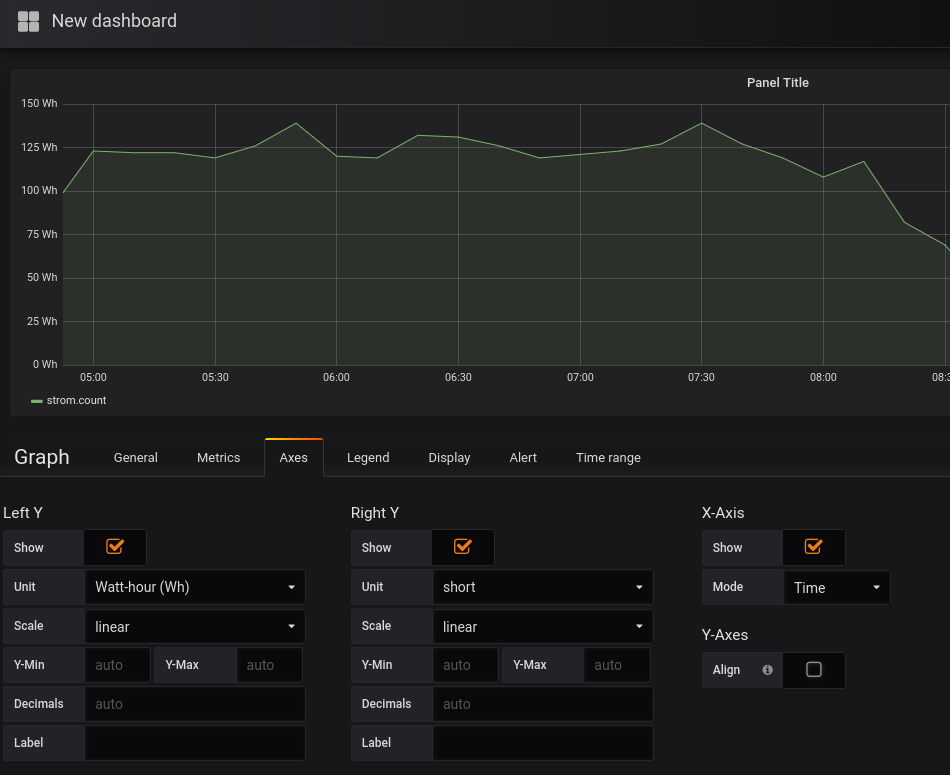
Now in the tab "Axes" select the "Unit" Energy -> Watt-hour (Wh)
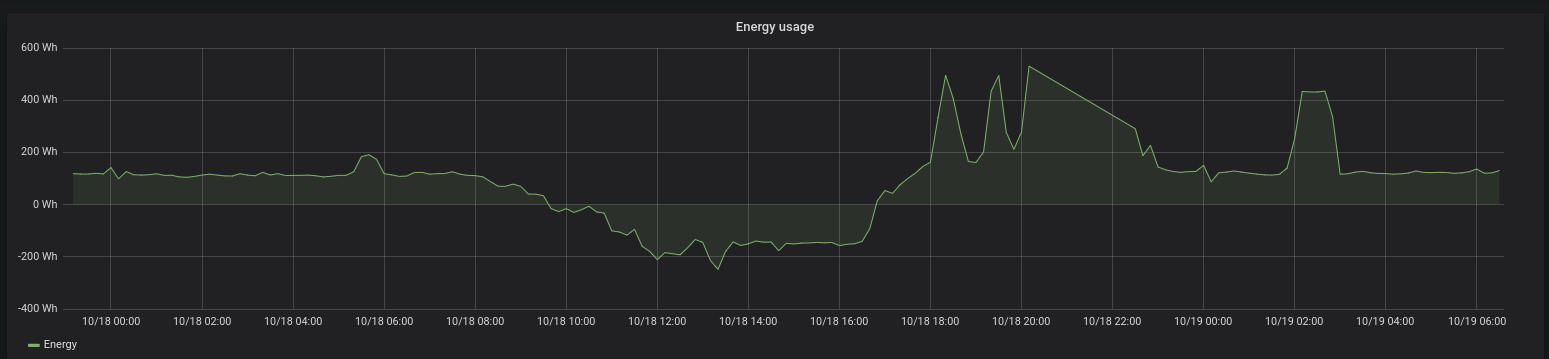
Just don't look at it too often, you'll hate your computers

Comment using SSH! Info