Note: This tutorial is working for Windows Server 2003 to 2012R2 with NPS installed. It's not currently working with freeradius
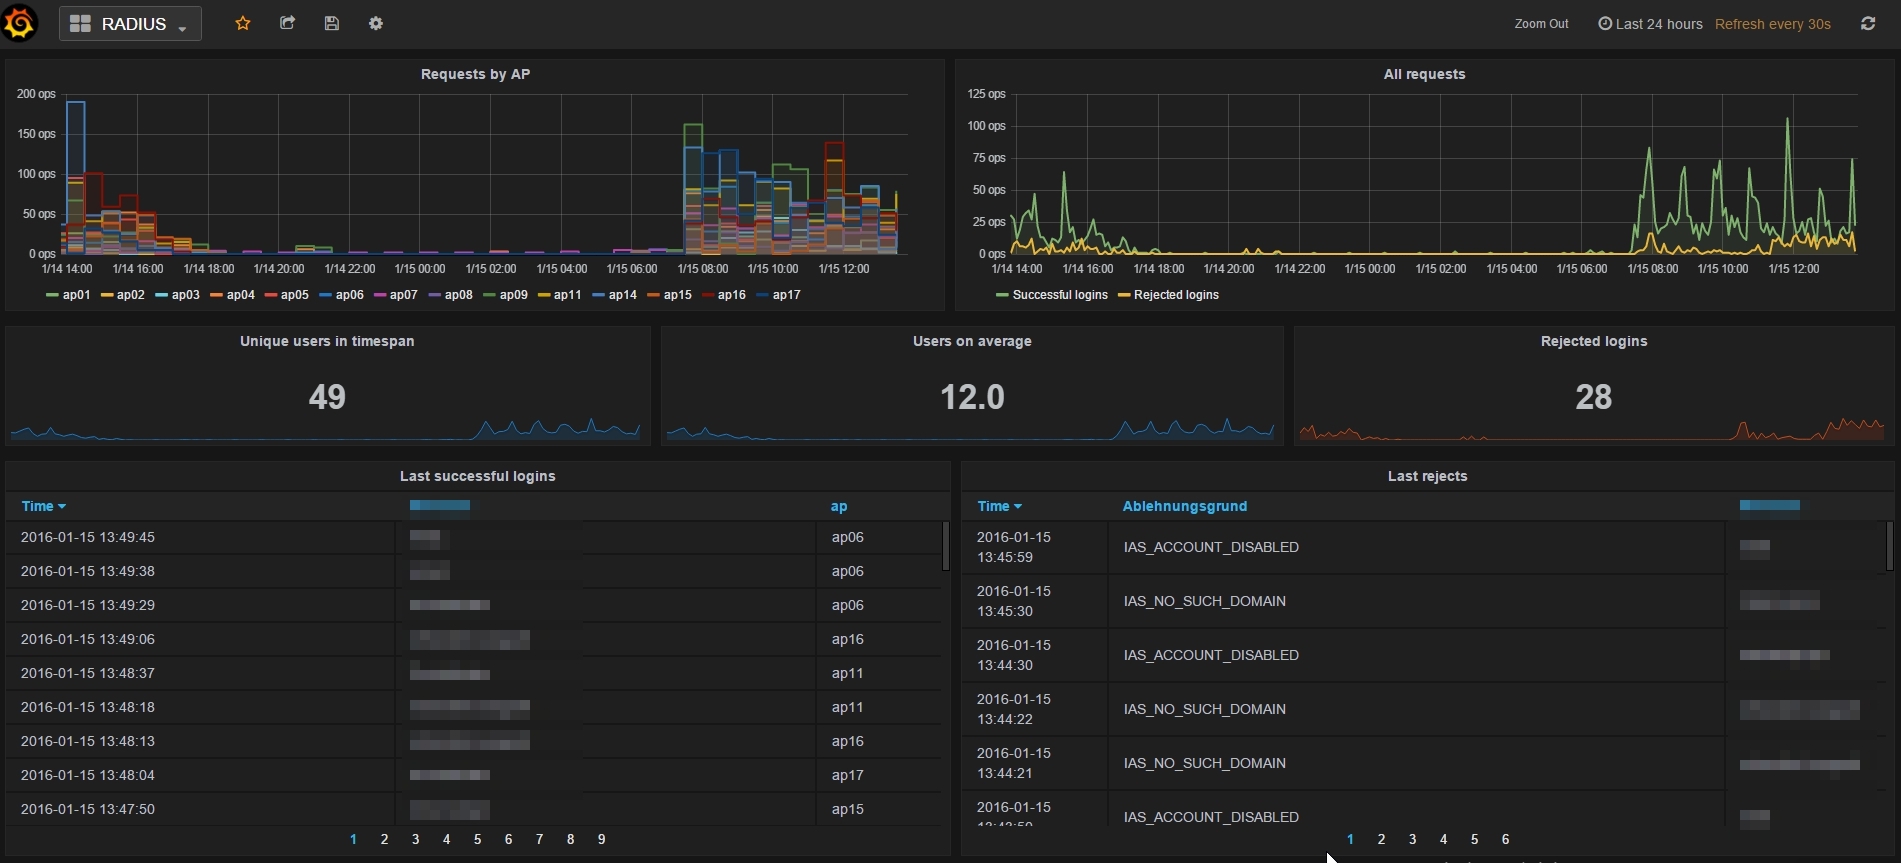
After finishing this tutorial you'll have a live graph of your RADIUS connections and see which users are having troubles connecting.
Security
Before we begin keep in mind that none of the servers or services I'm describing should be available from the internet. This should only be implemented in a LAN environment because the traffic will be unencrypted. Don't install the database or the dashboard on a device that is accessible through the internet.
What we'll need
- Windows Server 2003 to 2012R2 (didn't test it on 2016 yet) with NPS enabled and acting as RADIUS Server for some Access Points
- Configure the NPS logging (NPS -> Accounting -> Logging settings) to save in the format
ODBC (Legacy)and "Monthly" - PHP on the Windows Server, get it here
- A linux box that'll run InfluxDB (the database) and Grafana (for the dashboard)
Setting up InfluxDB
InfluxDB is my database of choice since it's built up from the ground as a time based database. That means every entry will automatically have the time as index (primary key).
Installing
My explanations work with debian based systems. For other systems like OSX use this guide
wget http://influxdb.s3.amazonaws.com/influxdb_0.9.5.1_amd64.deb
sudo dpkg -i influxdb_0.9.5.1_amd64.deb
Changing the config
Since we want the best performance we'll send our RADIUS data over UDP. To enable this edit the influxDB config file nano /etc/influxdb/influxdb.conf and replace the [[udp]] config with these lines:
[[udp]]
  enabled = true
  bind-address = ":8090"
  database = "radius"
  batch-size = 5000 # will flush if this many points get buffered
  batch-timeout = "1s" # will flush at least this often even if the batch-size is not reached
  batch-pending = 10 # number of batches that may be pending in memory
  read-buffer = 0 # UDP read buffer size, 0 means to use OS default
Restarting InfluxDB
service influxdb restartAfter restarting influxDB the "radius" database will automatically be created and linked to the UDP Port 8090
You can confirm that influxDB is working by surfing to http://ip.of.your.influxdb.box:8083 (8083 is the default webinterface port for influxDB)
Collecting RADIUS data
This is where the magic happens. Since we can't change the NPS RADIUS Server to serve to influxDB directly, we'll have to parse the log files.
Make sure your logfiles exist at C:\Windows\System32\LogFiles. They should start with "IN" and then year, month and ".log" as extension. eg: C:\Windows\System32\LogFiles\IN1601.log for january 2016.
I have created a GitHub project for this: https://github.com/geek-at/influxdb_radius_analyzer
Get the parser
Download the parser to your Windows Box
git clone https://github.com/geek-at/influxdb_radius_analyzer.gitAlternatively download it from here
Change the config
Edit the first lines in the analyze_influx.php file so it points to the right IP of the influxDB server and don't forget to set your timezone.
date_default_timezone_set('Europe/Vienna');

define('IMPORT_OLD',false);
define('USERADIUSTIME',true);
define('PATH',"C:\\Windows\\System32\\LogFiles\\IN");
define('DBNAME','radius');
define('DBIP','192.168.1.117');
define('DBPORT',8090);
define('ONLYNEWDATA',true);
What do these things mean?
IMPORT_OLD (bool)
If set to true, you can import old log files. The parser will exit after importing all. If you do this more than once you'll have double entries. Also keep in mind that these log files are around 100MB per month and parsing them might use very much memory on your influxDB box! I imported data from 2011 to 2015 and it used about 16gigs while importing.
If set to false the parser will parse the current log file only and wait for it to change and parse again. This means the script will run until you kill it. You might want to consider creating a system service that starts this script automatically. There are tools for that
USERADIUSTIME (bool)
If set to true, the script will parse the time from the logfiles and put them into influxDB. It's recommended since otherwise you might have wrong dates
If set to false it will insert the data with the current server time
PATH (string)
Is the path to your log files. This should only be changed if you are testing the script for testing
DB* (string/int)
DBNAME, DBIP and DBPORT are the settings on which InfluxDB to connect. These settings should be set acordingly to the /etc/influxdb/influxdb.conf file and point to the IP of the influxDB server.
ONLYNEWDATA (bool)
If set to true, the script will create a text file where it stores the last timestamp it sent to the database. This is useful because it prevents double data insertion when you start the script twice
If set to false it will parse the whole file and put it in the database even if this file has already been parsed before
Should be working now!
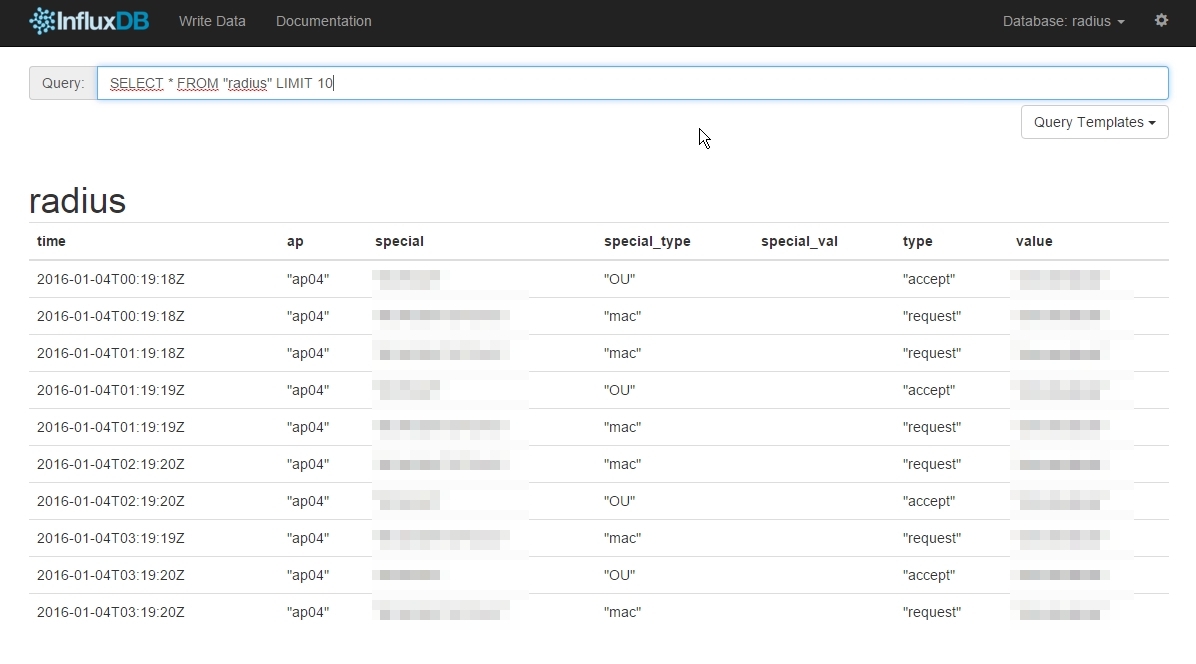
If you start the script on the server (with php installed) it should parse and fill your database. You can confirm this by pointing your browser to http://ip.of.your.influxdb.box:8083, selecting the "radius" database in the top right corner and using a query like:
SELECT * FROM "radius" LIMIT 10It should show something like this:
Last step: Get Grafana and make nice graphs
Note: This step could be done from the Windows box too but I like to put Grafana and InfluxDB on the same box so I can work with "localhost" and it doesn't use any more traffic.
Download + Install
Download Grafana from here
Then start Grafana service grafana-server start.
Point your browser to http://ip.of.your.grafana.box:3000 (3000 is the default port for Grafana)
Create a datasource
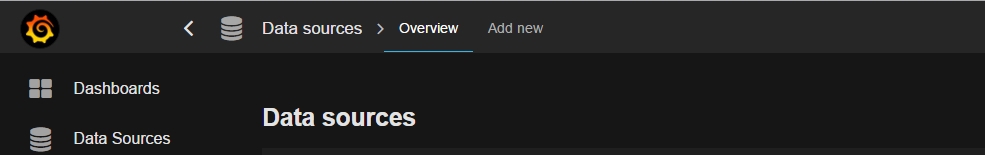
After creating your admin account and logging in you have to create a Data Source. Top right -> Add new
Then fill in:
- Name: radius
- Type: InfluxDB 0.9.x
- Url: http://localhost:8086 (or use the IP of the InfluxDB Server if it's not on the same machine)
- Database: radius
- User: radius
- Password: radius
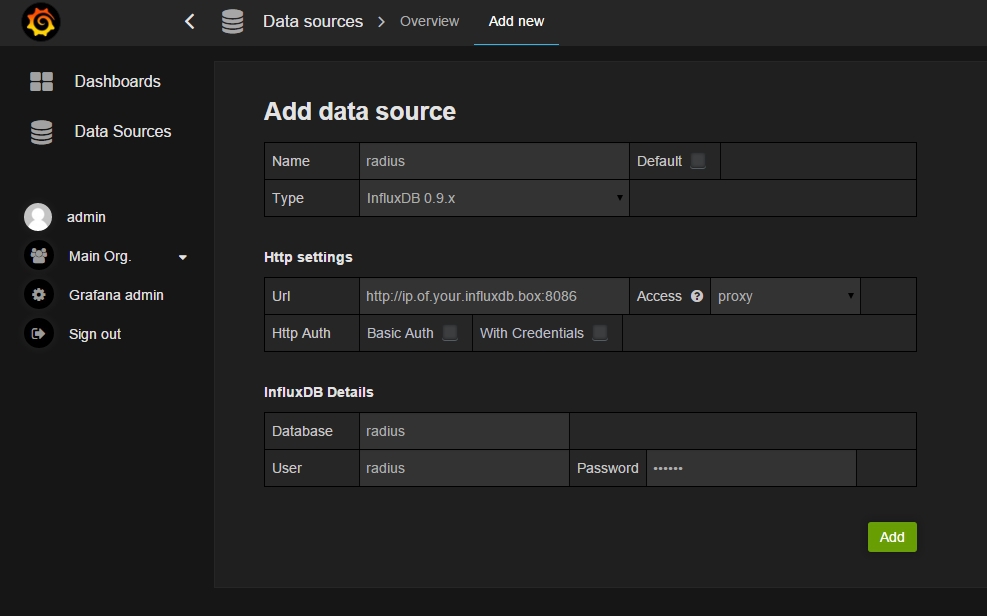
And click "Add"
Almost done!
Import the Dashboard
Surf to http://ip.of.your.grafana.box:3000/import/dashboard and import the grafana_dashboard.json from the Git repo
And click "Import"
Finished!
You should now see your dashboard which automatically updates and displays all connections.

Comment using SSH! Info